01
Pair comparison
Load a Base and Comparison run, inspect FPS, frame time, PC latency, GPU/CPU utilization and other available telemetry, and see direction-aware KPI deltas at a glance.
Frame Performance Analyzer turns NVIDIA FrameView captures and NVIDIA App performance logs into an interactive benchmark workspace for serious comparisons, adaptive chart analysis, and presentation-ready or portable exports.
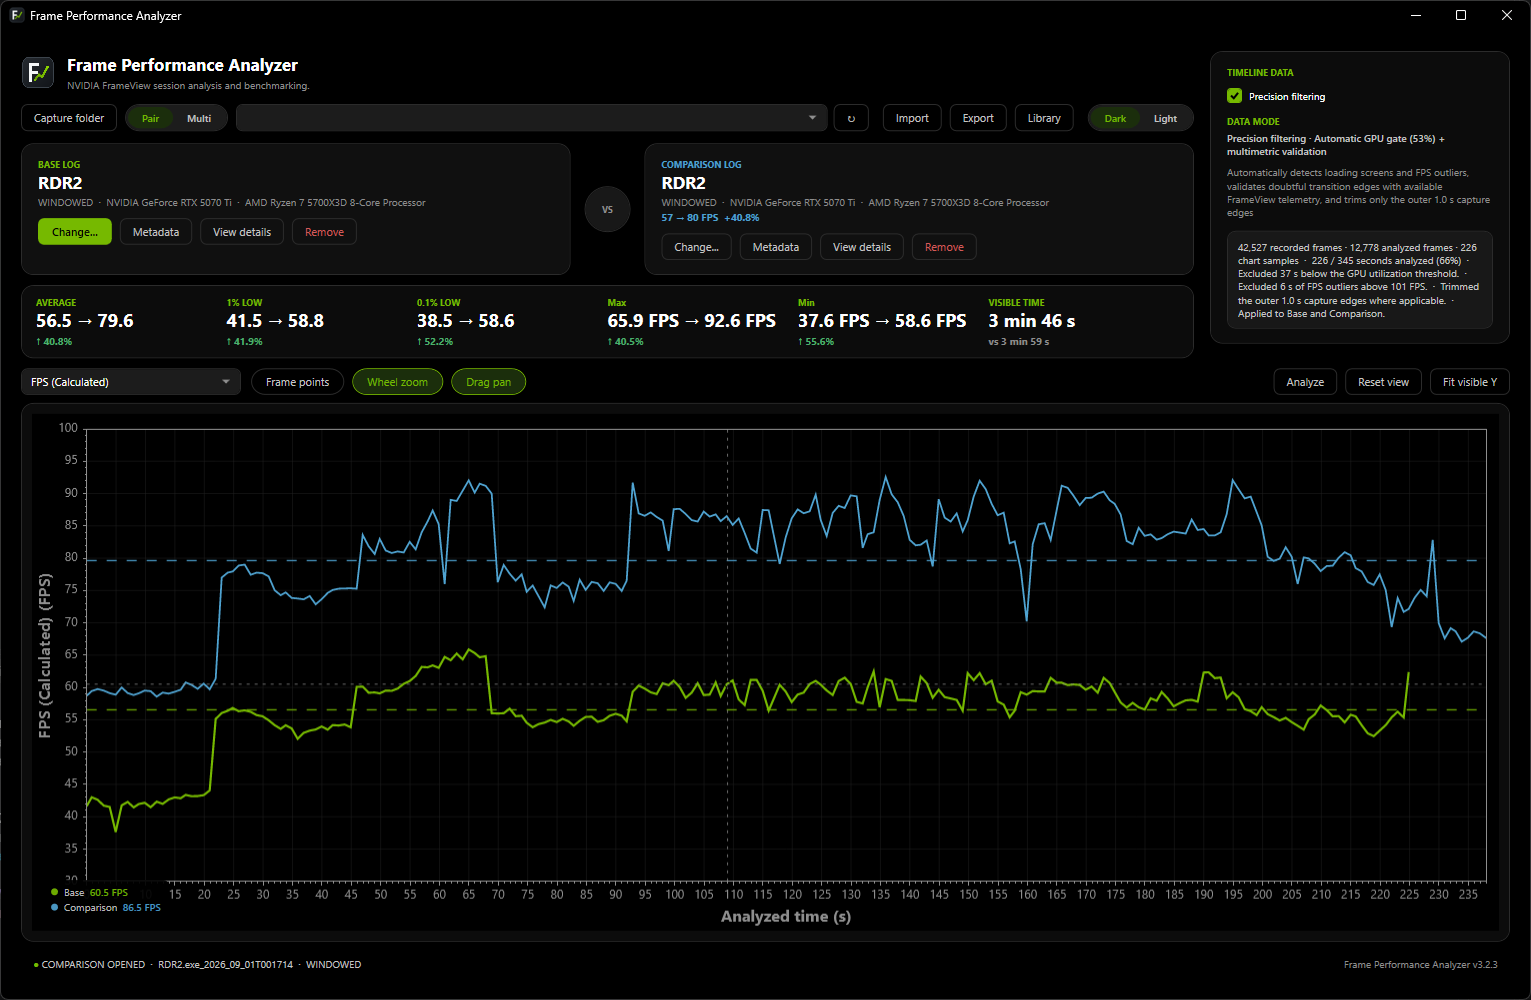
Frame Performance Analyzer keeps the raw capture useful while removing the spreadsheet archaeology. Compare runs, focus on the section that matters, preserve benchmark context, and export results without rebuilding every graph by hand.
Load a Base and Comparison run, inspect FPS, frame time, PC latency, GPU/CPU utilization and other available telemetry, and see direction-aware KPI deltas at a glance.
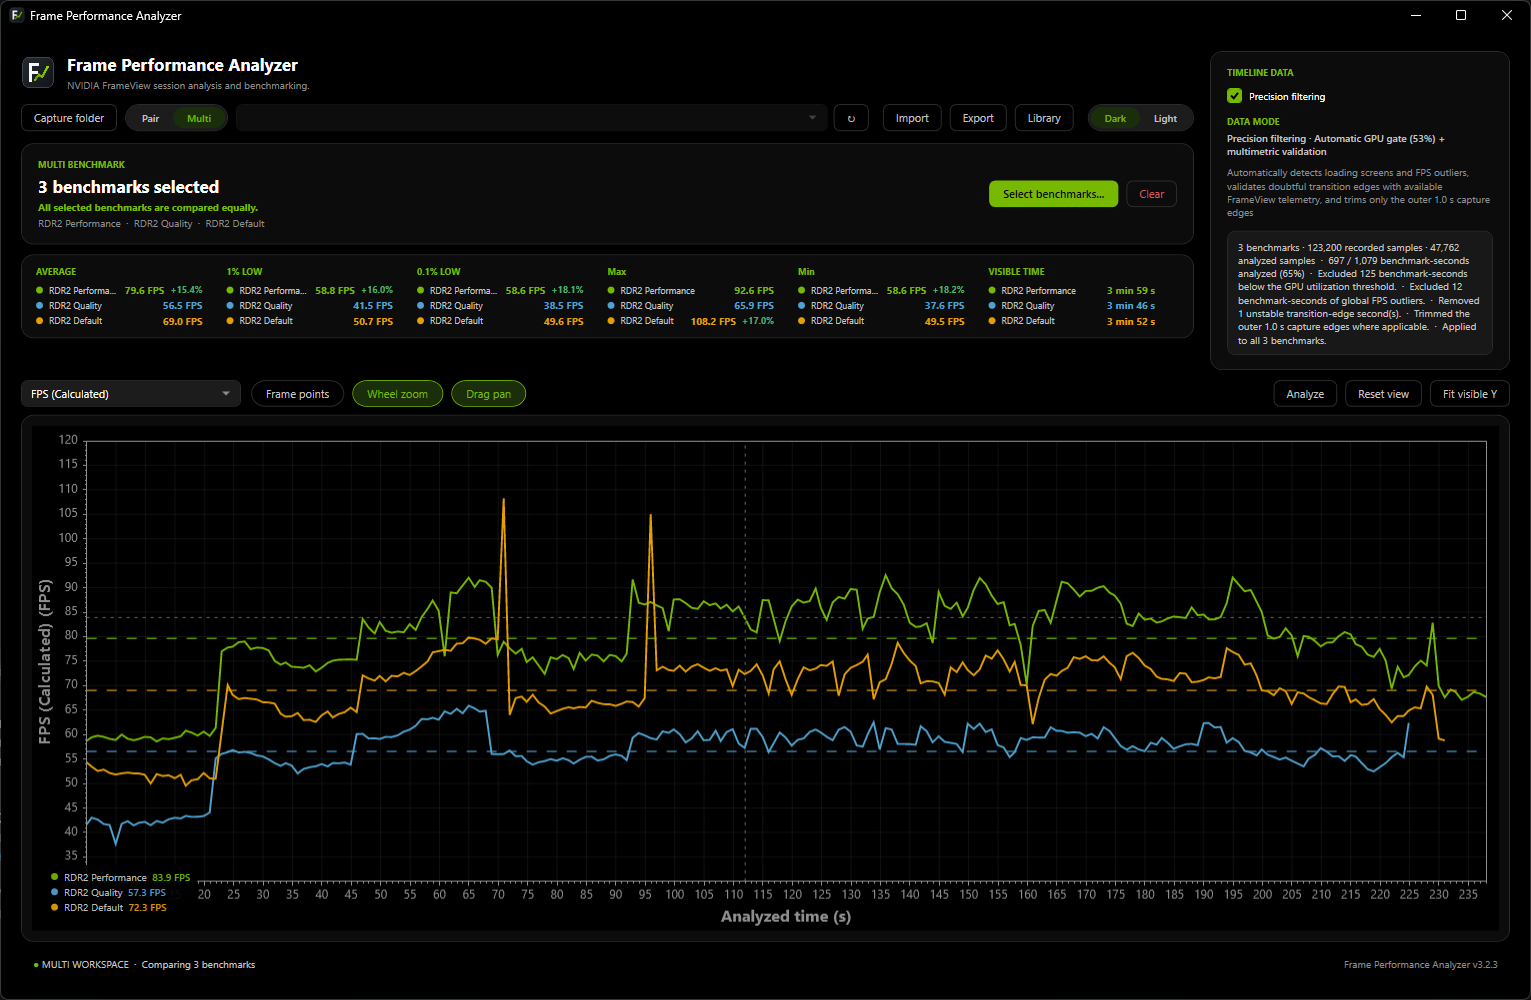
Compare 2–8 captures as equal peers with stable colors across charts, KPI rows, selectors, and exported reports. Ideal for graphics-setting and technology shootouts.
Choose the complete raw capture or conservatively remove loading screens, transitions, abnormal FPS regions, and capture edges through one automatic multivariable pipeline.
Replace the one-second summary with real per-frame values, zoom to reveal progressive source detail, and keep full-resolution statistics while scales adapt to the visible range.
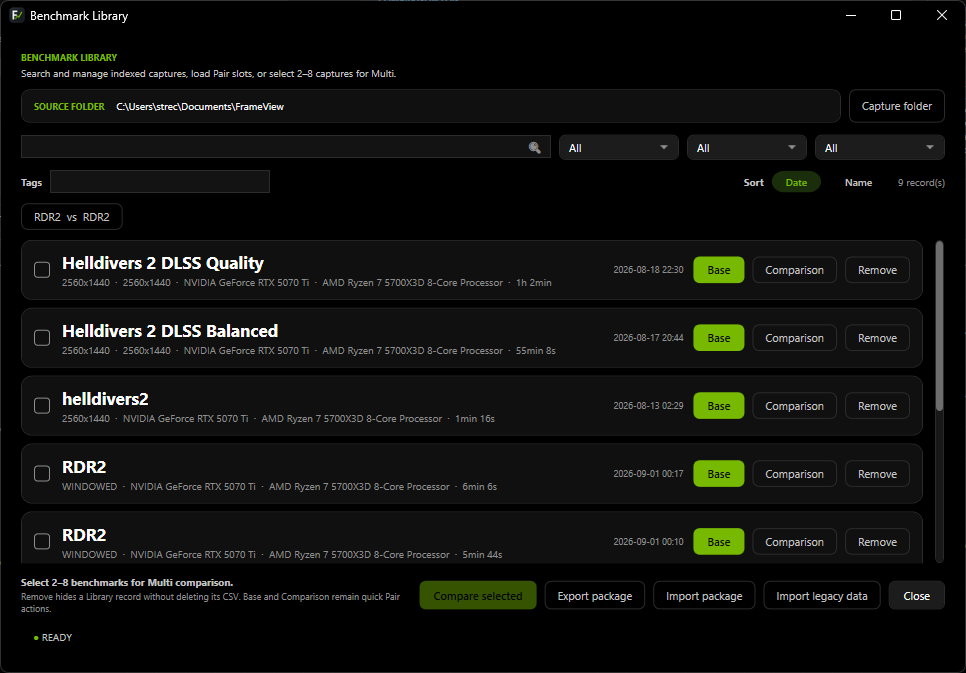
Search and select Library or capture-folder runs for Pair and Multi, with role colors, custom metadata names, filters, sorting, and non-destructive Library management.
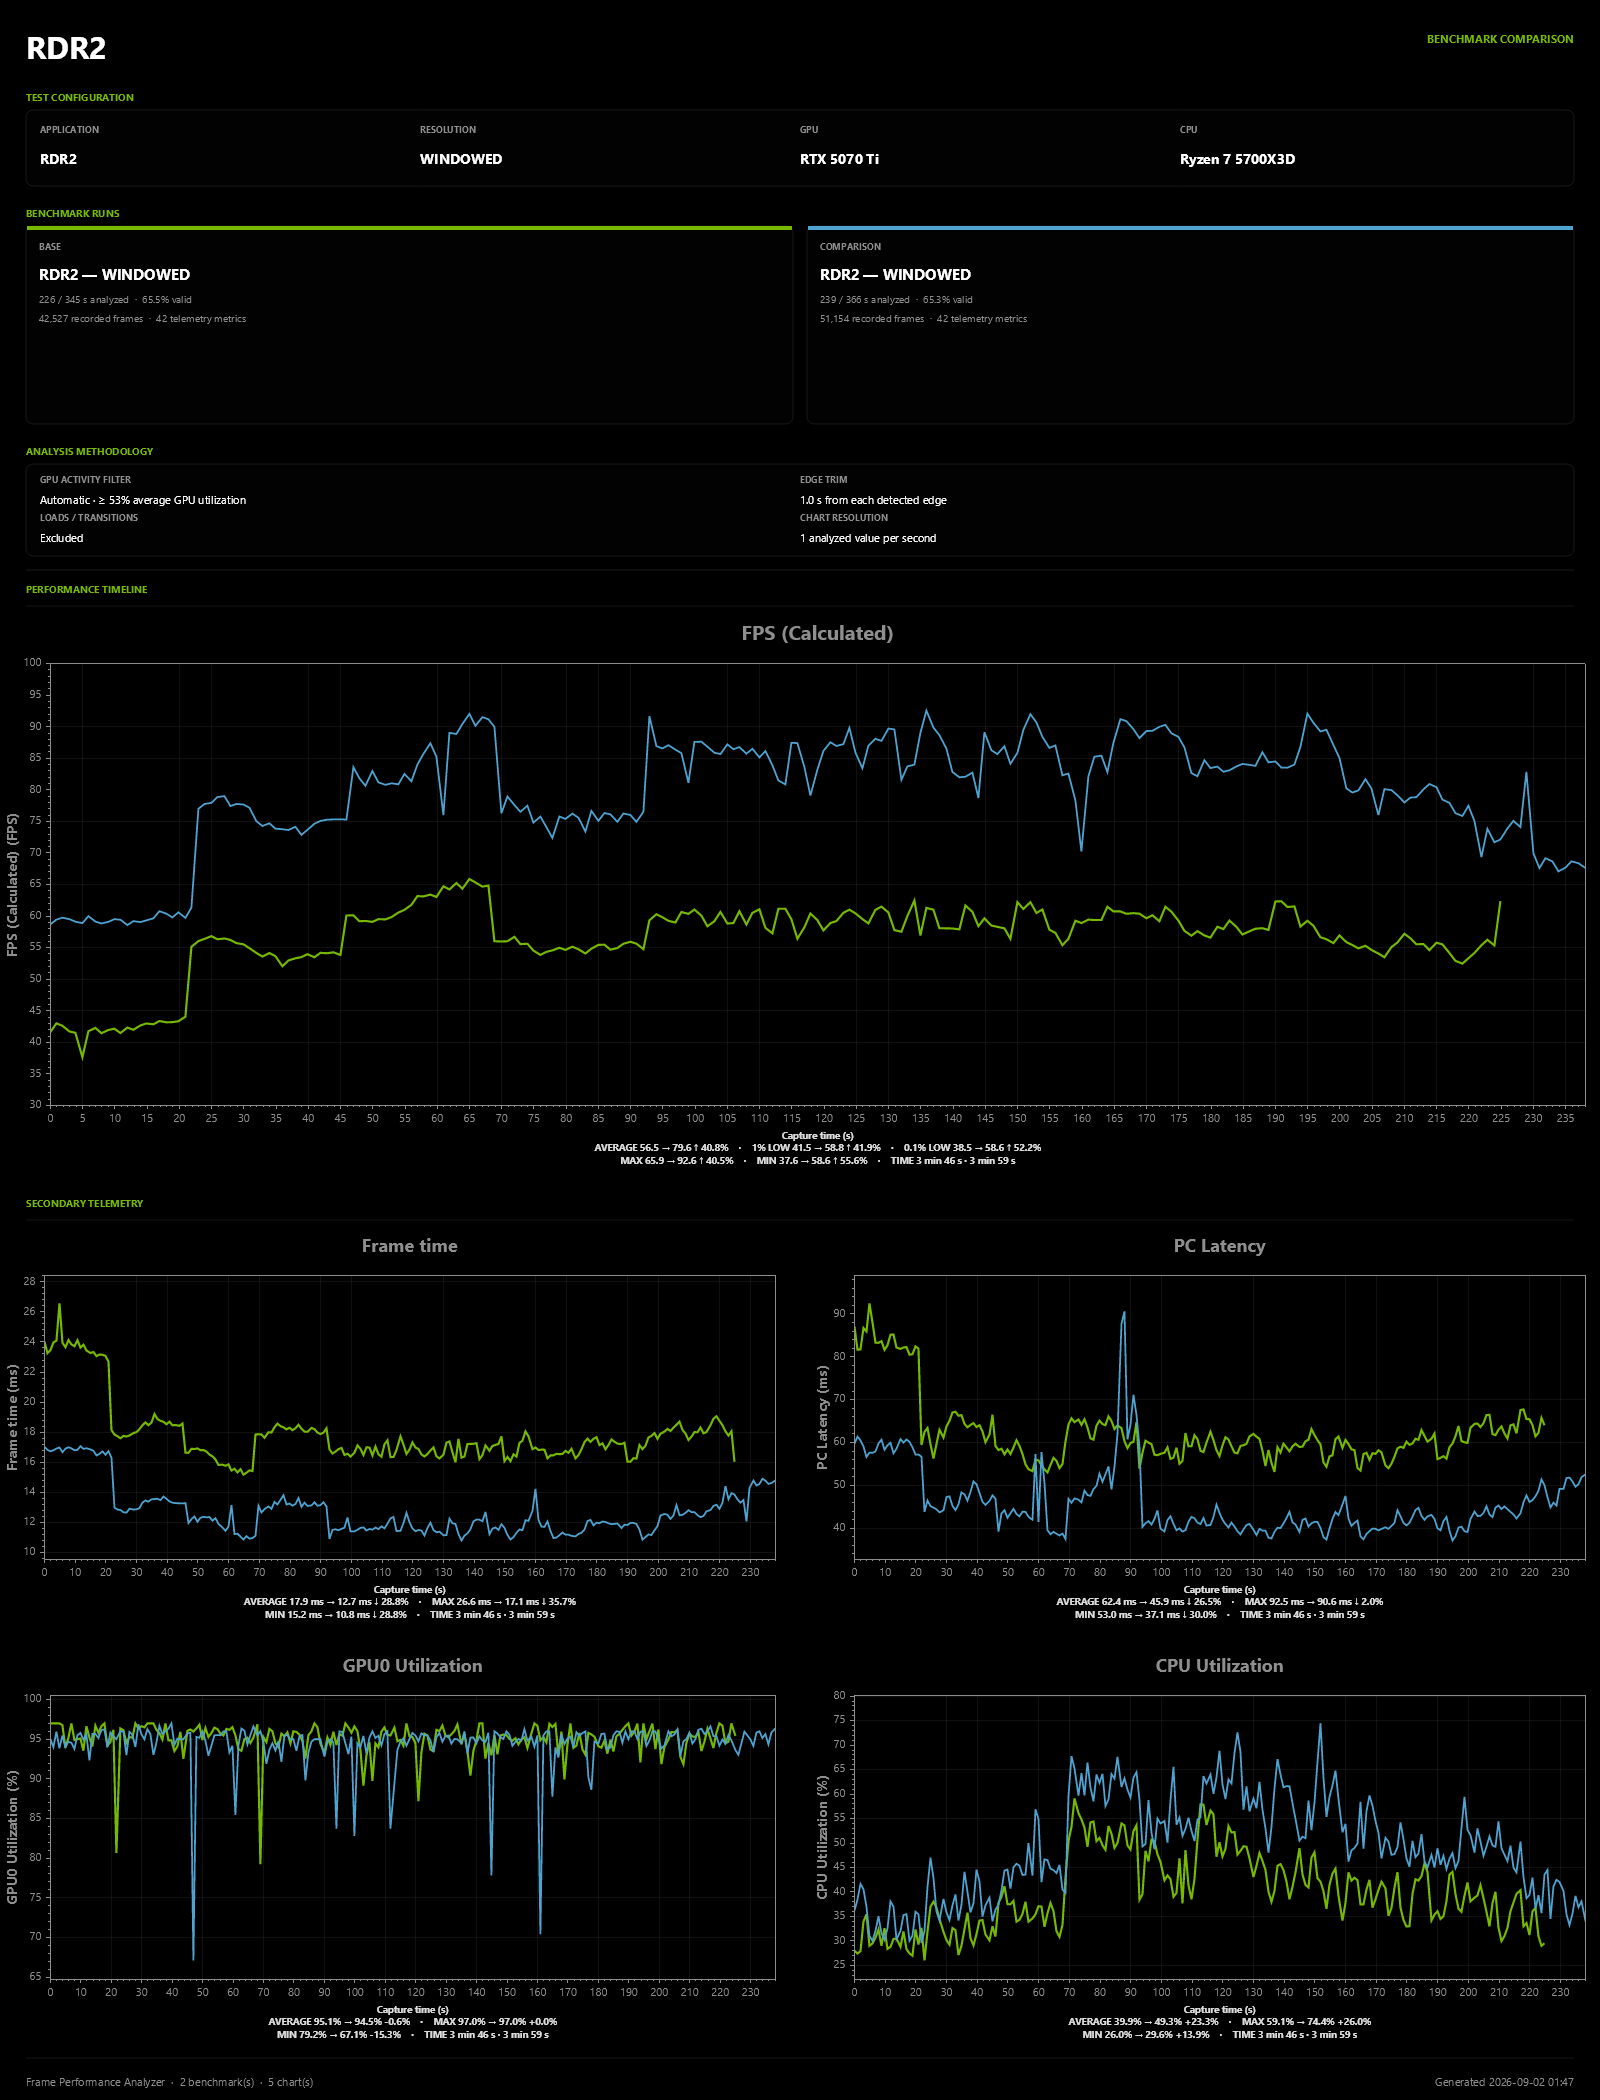
Export the current visible range to professional PNG reports or analyzed CSV/JSON snapshots, then import those portable data files back into Frame Performance Analyzer later.
These screenshots are from Frame Performance Analyzer using real benchmark captures. The website reuses the same canonical screenshots shown in the repository README.
Record a supported NVIDIA FrameView detailed log or NVIDIA App performance-overlay CSV, or reopen a portable analyzed-data export.
Open Pair or Multi, choose Raw or Precision filtering, inspect summary or frame-level telemetry, preserve a selected time window across metrics, and add benchmark metadata.
Export the visible range as a professional PNG report or portable CSV/JSON analyzed-data snapshot that can be imported again later.
Frame Performance Analyzer processes captures on your PC. It is open source, contains no telemetry, and makes no network calls during normal analysis. You can inspect the source, build it yourself, or verify release checksums on GitHub.
Install from Microsoft Store or use the portable self-contained GitHub release.